Item History & Snapshots
Item History & Snapshots Reporter for monday.com
User Guide
Overview
Item History & Snapshots Reporter helps you investigate changes to your monday.com boards, examine historical item data, and compare item values between different points in time.
The application provides three reporting capabilities:
Item History — Investigate board activity, including what changed, when it changed, who made the change, and the previous and new values.
Item Snapshot — Examine item data at a selected point in time.
Item Snapshot Comparison — Compare item data between two points in time to identify changes.
The application also includes advanced search and filtering, charts, configurable tables, and data export.
1. Installing the Application
Before using Item History & Snapshots Reporter, the application must be installed in your monday.com account.
Step 1 — Find the application
Sign in to your monday.com account.
Open the monday.com Apps Marketplace.
Search for Item History & Snapshots Reporter.
Open the application's Marketplace listing.
Step 2 — Install the application
Click Install app.
Follow the installation prompts.
Select the applicable plan if prompted.
Approve any required permissions and complete installation.
Depending on your monday.com account settings, administrator approval may be required.
Important: Installing the application makes it available in your monday.com account. It does not automatically add the application to every board.
2. Adding the Application to a Board
Item History & Snapshots Reporter operates as a monday.com board view.
You must add the application view to each board where you want to use it.
Step 1 — Open your board
Navigate to your monday.com workspace.
Open the board you want to investigate.
Locate the board view tabs near the top of the board, next to Main table.
Step 2 — Add the application view
Click the + button beside the existing board view tabs.
Open the available views or apps section.
Locate Item History & Snapshots Reporter among your installed applications.
Select it to add the view to your board.
If the application is not immediately visible, use the view selection dialog to locate installed apps.
Step 3 — Open the application
Once added, the application appears as a new tab alongside your other board views.

Click its tab to open the reporting interface.
The application header displays the currently selected board.
Important: Adding the view to one board does not automatically add it to other boards. Repeat this procedure for additional boards.
3. Understanding the Application Interface
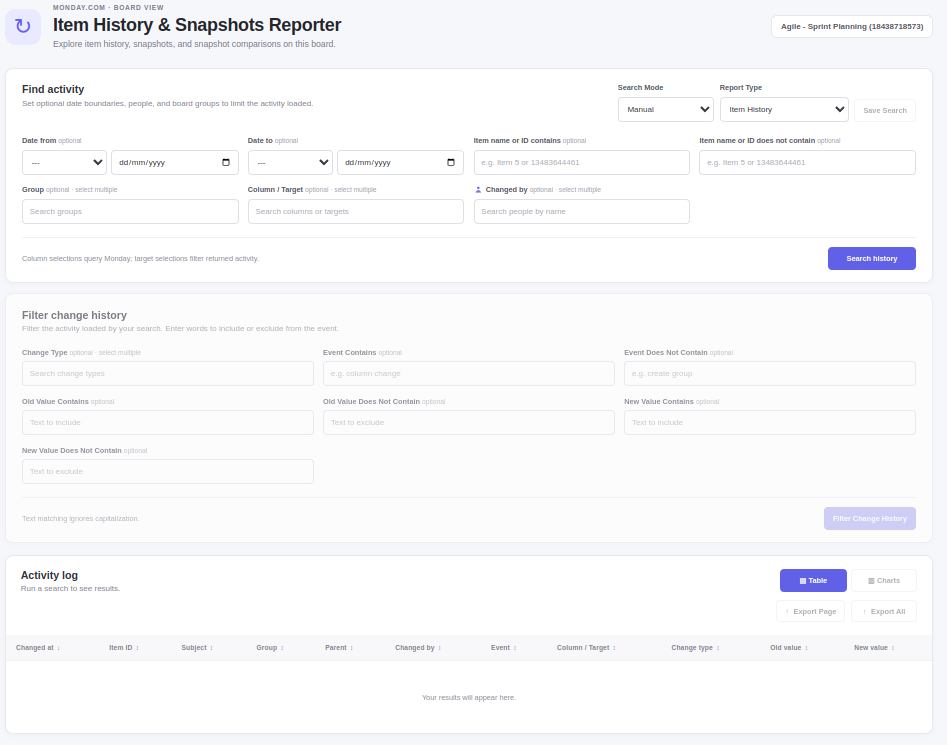
The application provides a search interface followed by reporting results.
The main components are:
Find activity
Defines the historical data to retrieve using dates, item names or IDs, groups, columns, and users.
Filter change history
Applies additional filtering to the retrieved history using change types, event descriptions, and old or new values.
Report results
Displays the information in tables or charts, depending on the selected report.
At the top of the application, the Search Mode, Report Type, and Save Search controls are available.
Available report types
| Report | Purpose |
|---|---|
| Item History | Investigate historical changes and board activity |
| Item Snapshot | View item values at a selected historical point |
| Item Snapshot Comparison | Compare item values between two historical points |
Select the required report using the Report Type dropdown.
4. Item History Report
The Item History report provides a chronological record of board activity.
It allows you to investigate questions such as:
Who changed an item's status?
When was a priority changed?
What was the previous value of a column?
Which items were modified by a particular user?
What activity occurred during a specified period?
Search Criteria and Filtering
All fields in the Find activity section act as optional filters that determine which historical records are initially retrieved.
If a field is left empty or no selection is made, no filtering is applied for that criterion. For example:
If no dates are specified, all available historical dates are considered.
If no groups are selected, activity from all groups is considered.
If no columns or targets are selected, activity is not restricted to specific columns or targets.
If no users are selected, activity performed by all users is considered.
If no item name or ID criteria are provided, activity is not restricted to specific items.
When multiple criteria are specified, they are combined to narrow the retrieved results.
This initial filtering is separate from the Filter change history section, which applies additional filters to the records already retrieved.
4.1 Selecting Item History
Open the application.
Locate the Report Type dropdown.
Select Item History.
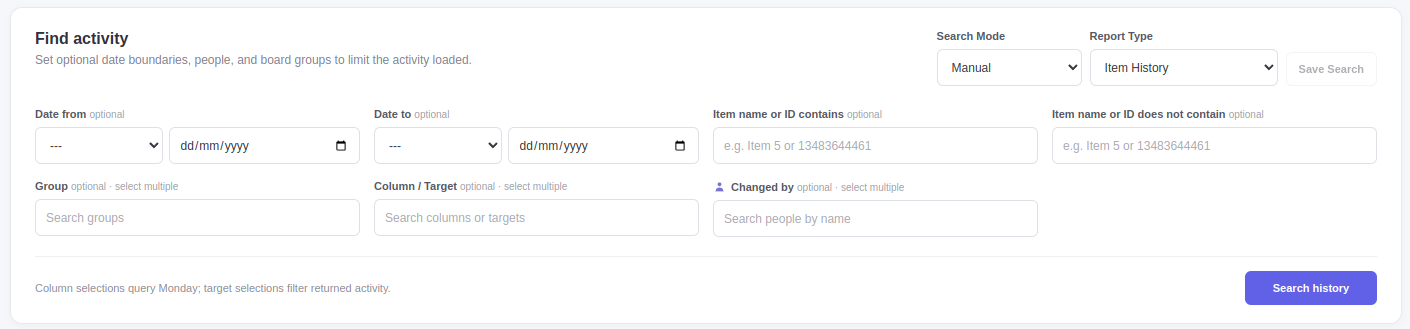
The Find activity section provides the available search criteria.
4.2 Search Mode
The Search Mode dropdown controls how search criteria are selected.
Select Manual to enter search criteria directly.
The interface also includes a Save Search button for retaining search configurations.
4.3 Date From and Date To
Use these controls to define the historical period you want to investigate.
Each boundary includes a dropdown and a date input.
Choose the desired option from the Date From dropdown.
Enter or select the starting date when applicable.
Choose the desired option from the Date To dropdown.
Enter or select the ending date when applicable.
These fields allow you to restrict the historical activity search to the period of interest.
4.4 Item Name or ID Contains
Enter text that must appear in the item name or ID.
Examples:
13483864461ReleaseSprint
Use this field to narrow the search to particular items.
4.5 Item Name or ID Does Not Contain
Enter text to exclude items whose names or IDs contain the specified value.
This is useful when you want to eliminate unrelated items from the search.
4.6 Group
The Group field allows you to select one or more groups from the current board.
Click Search groups.
Find the groups you want to include.
Select one or more groups.
Leave the field empty if no group restriction is needed.
4.7 Column / Target
Use Column / Target to select one or more columns or activity targets.
Click Search columns or targets.
Find the relevant columns or targets.
Select the desired entries.
Column selections are used when querying monday.com. Target selections filter the returned activity.
4.8 Changed By
The Changed By field allows you to restrict activity to selected users.
Click Search people by name.
Find the relevant users.
Select one or more people.
This is useful when investigating changes performed by particular team members.
4.9 Running the Search
After selecting the desired criteria:
Click Search history.
Wait for the application to retrieve the activity.
Review the results in the Activity log.
The number of loaded events is displayed above the results.
5. Filtering Change History
After retrieving activity, you can apply additional filters without defining a new historical search.
The Filter change history section provides filters for events, change types, and previous or new values.
[INSERT SCREENSHOT 3 — Filter change history section showing all available controls.]
5.1 Change Type
Select one or more change types to include in the results.
This allows you to focus on particular categories of changes.
5.2 Event Contains
Enter text that must appear in the event description.
Example:
Update Column Value
5.3 Event Does Not Contain
Enter text to exclude events containing a particular phrase.
Example:
Create Group
5.4 Old Value Contains
Find changes where the previous value contains specified text.
Example:
Done
This can identify changes made to items that previously had the value Done.
5.5 Old Value Does Not Contain
Exclude changes where the previous value contains specified text.
5.6 New Value Contains
Find changes where the new value contains specified text.
Example:
Stuck
This can identify changes that resulted in a Stuck status.
5.7 New Value Does Not Contain
Exclude changes where the new value contains specified text.
5.8 Applying the Filters
Enter the desired filter values.
Select any relevant change types.
Click Filter Change History.
Review the filtered activity.
Text matching ignores capitalization.
The Find activity and Filter change history sections serve different purposes:
Find activity determines which records are retrieved.
Filter change history narrows the records already loaded.
6. Understanding the Activity Log
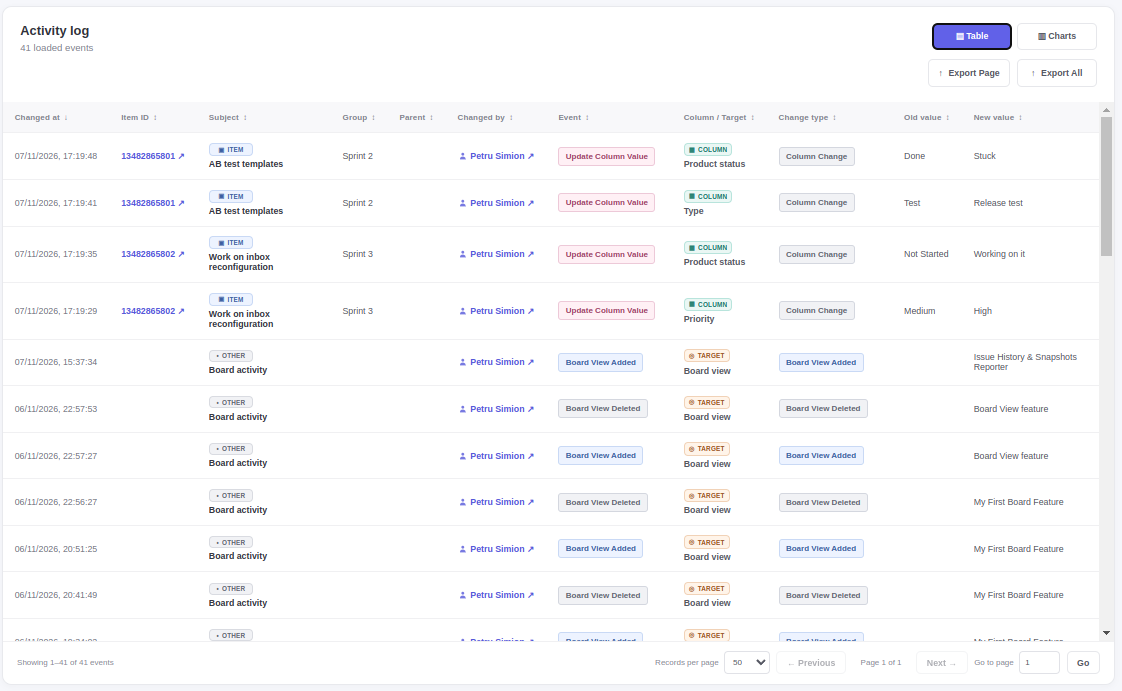
The Activity log presents historical events in a table.
Each row represents an activity record returned by the search.
6.1 Activity Log Columns
| Column | Description |
|---|---|
| Changed at | Date and time of the activity |
| Item ID | Identifier of the associated item |
| Subject | Name or description of the affected item or subject |
| Group | Associated board group |
| Parent | Parent item information, where applicable |
| Changed by | User associated with the activity |
| Event | Activity event |
| Column / Target | Column or target affected by the event |
| Change type | Classification of the change |
| Old value | Value before the change |
| New value | Value after the change |
The table may include both item-related and board-related events.
6.2 Identifying Changes
For column value changes, examine:
Changed at to determine when the change occurred.
Changed by to identify the user.
Column / Target to identify the affected field.
Old value to see the previous value.
New value to see the resulting value.
For example:
| Changed at | Column | Old value | New value |
|---|---|---|---|
| 07/11/2026 | Product status | Done | Stuck |
| 07/11/2026 | Priority | Medium | High |
6.3 Sorting Results
The table provides sortable column headers.
Click a supported column header to change the sorting order.
6.4 Pagination
At the bottom of the table, you can:
Select the number of records displayed per page.
Navigate using Previous and Next.
Enter a page number in Go to page.
Click Go to navigate directly to that page.
The footer also displays the current record range and total number of events.
6.5 Exporting Results
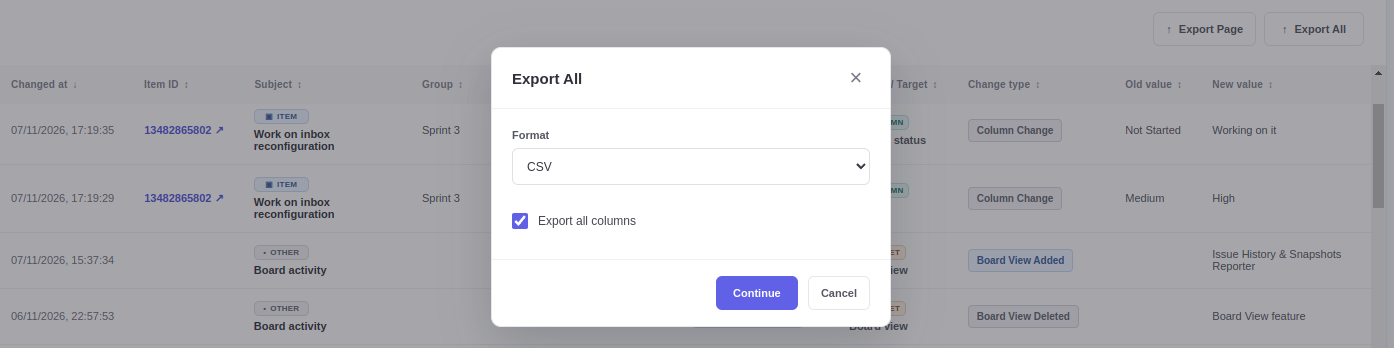
The Activity Log provides two export options.
Export Page
Exports the records on the currently displayed page.
Export All
Exports the complete result set represented by the report.
Both options allow you to:
Choose the file format: CSV or Excel.
Choose which columns to export:
All Columns: Exports all available columns, regardless of whether they are displayed on the screen.
Visible Columns: Exports only the columns currently displayed in the report, as configured using the Set Visible Columns button.
Use Export Page for a limited selection or Export All for the full report.
7. Visualizing Historical Activity with Charts
The Activity log supports graphical reporting.
Charts help summarize historical activity and identify patterns without examining every event individually.
7.1 Opening Charts
Run an Item History search.
Locate the Table and Charts buttons above the results.
Click Charts.
The results switch from the table to a chart.
[INSERT SCREENSHOT 5 — Activity log displayed as a bar chart.]
7.2 Chart By
Use the Chart By dropdown to choose how the loaded events are grouped.
For example, selecting Event groups activity according to event type.
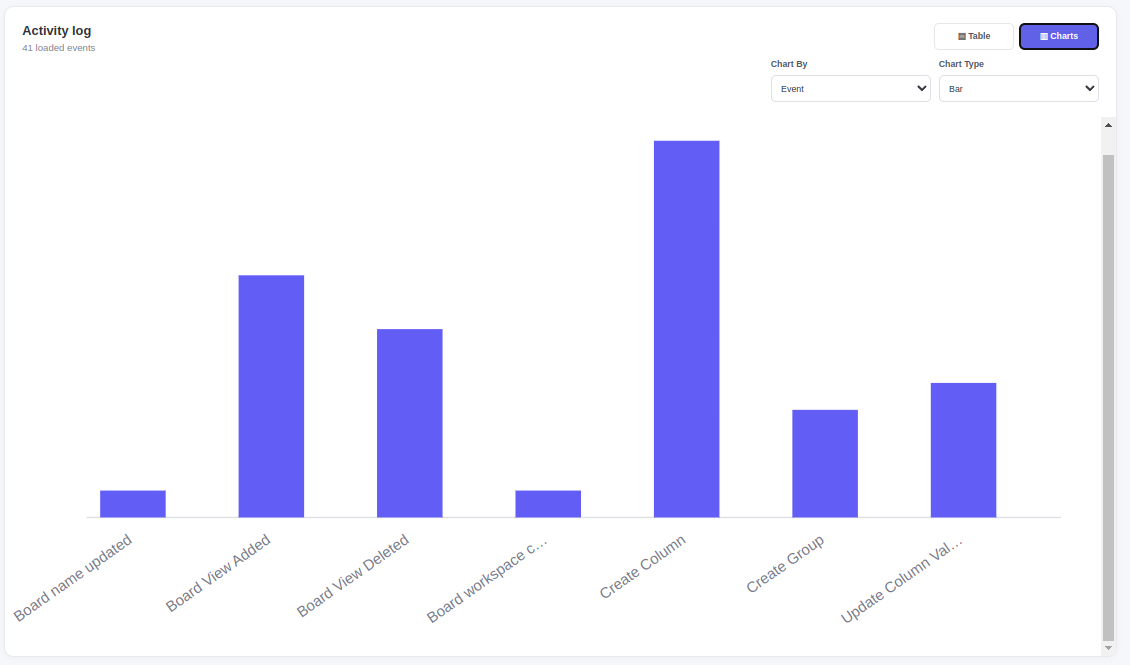
7.3 Chart Type
Use the Chart Type dropdown to choose the graphical presentation.
For example, select Bar to display event counts as bars.
7.4 Returning to the Table
Click Table to return to the detailed activity records.
Charts provide a summarized view, while the table provides individual event details.
8. Item Snapshot Report
The Item Snapshot report allows you to examine item data at a selected point in time.
Instead of reviewing individual changes, this report presents item values in a tabular format.
This is useful when you want to investigate:
What values items had at a particular date.
Which statuses were assigned at that time.
What priorities or other column values were recorded.
How the board's item data appeared historically.
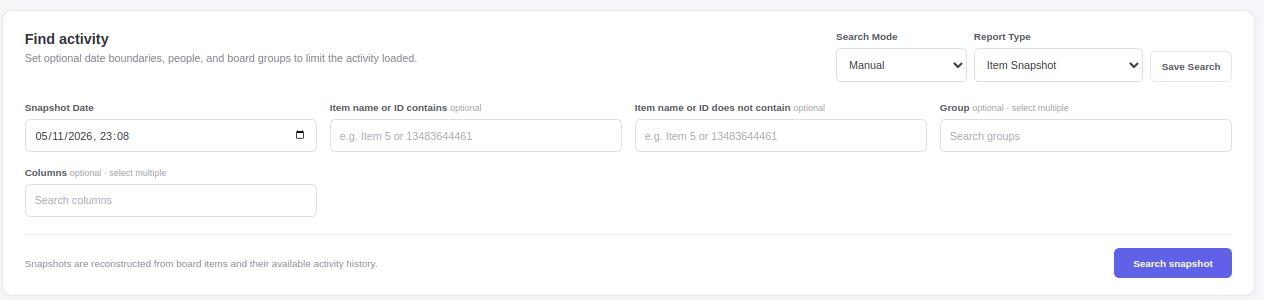
8.1 Creating a Snapshot
Open the application.
Select Item Snapshot from the Report Type dropdown.
Configure the relevant date and item selection criteria.
Run the report.
Review the resulting Item Snapshot table.
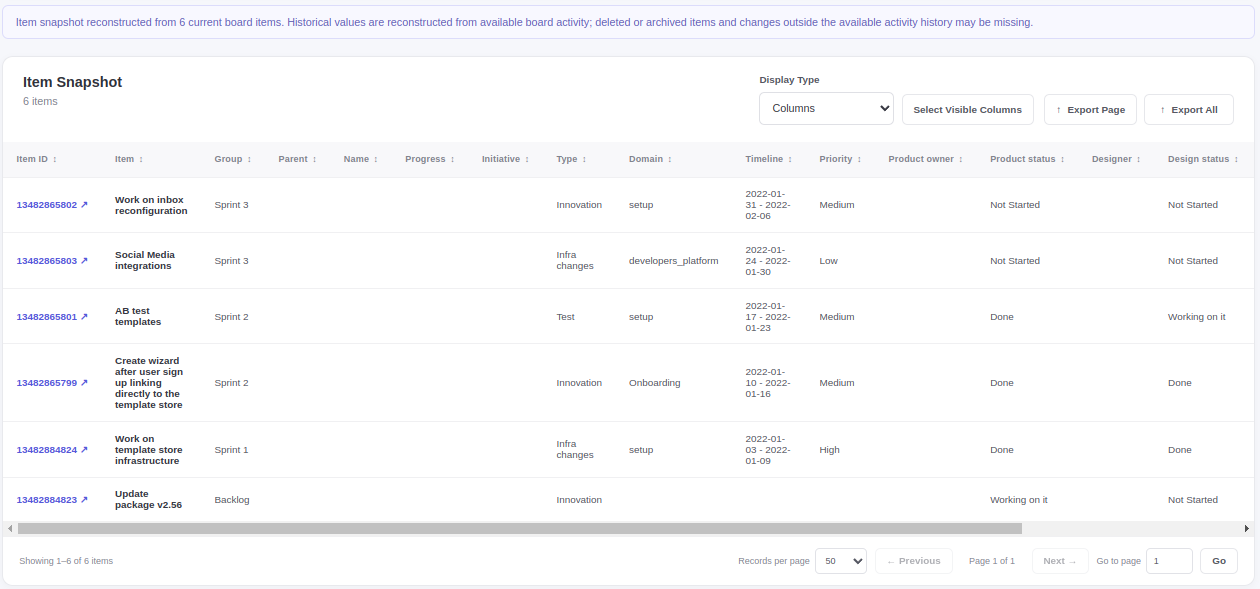
8.2 Understanding the Snapshot Table
Each row represents an item.
The columns display the item's data for the selected snapshot.
Depending on the board configuration, the table can include:
Name
Parent
Progress
Initiative
Type
Domain
Timeline
Priority
Product owner
Product status
Designer
Design status
Developer
Development status
Estimated effort
The available columns depend on the board's structure.
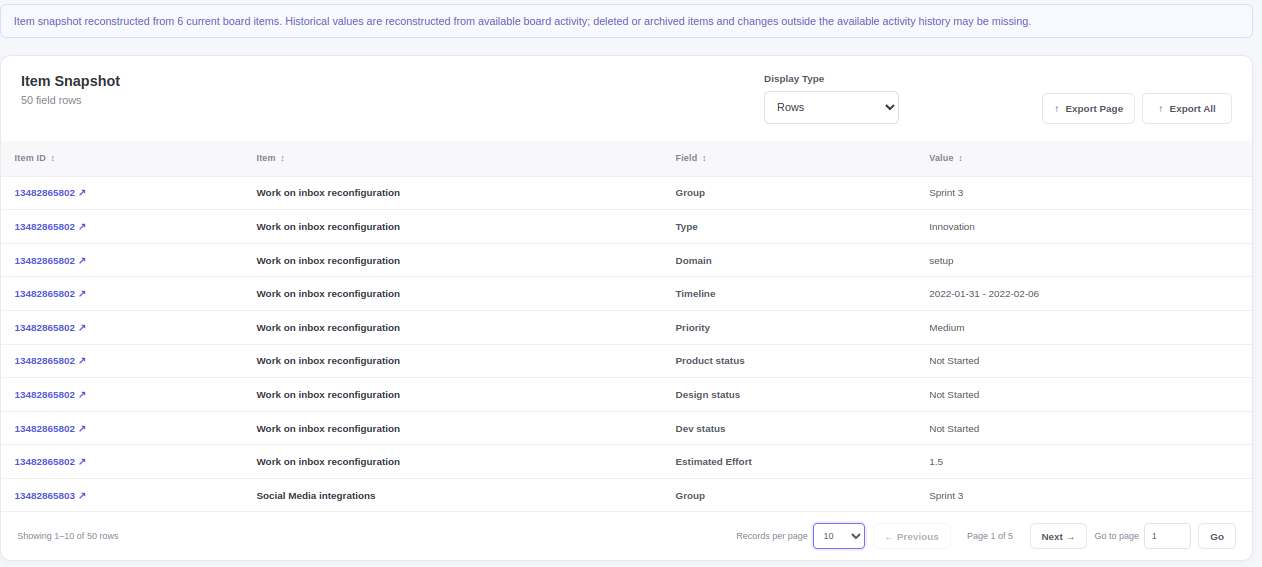
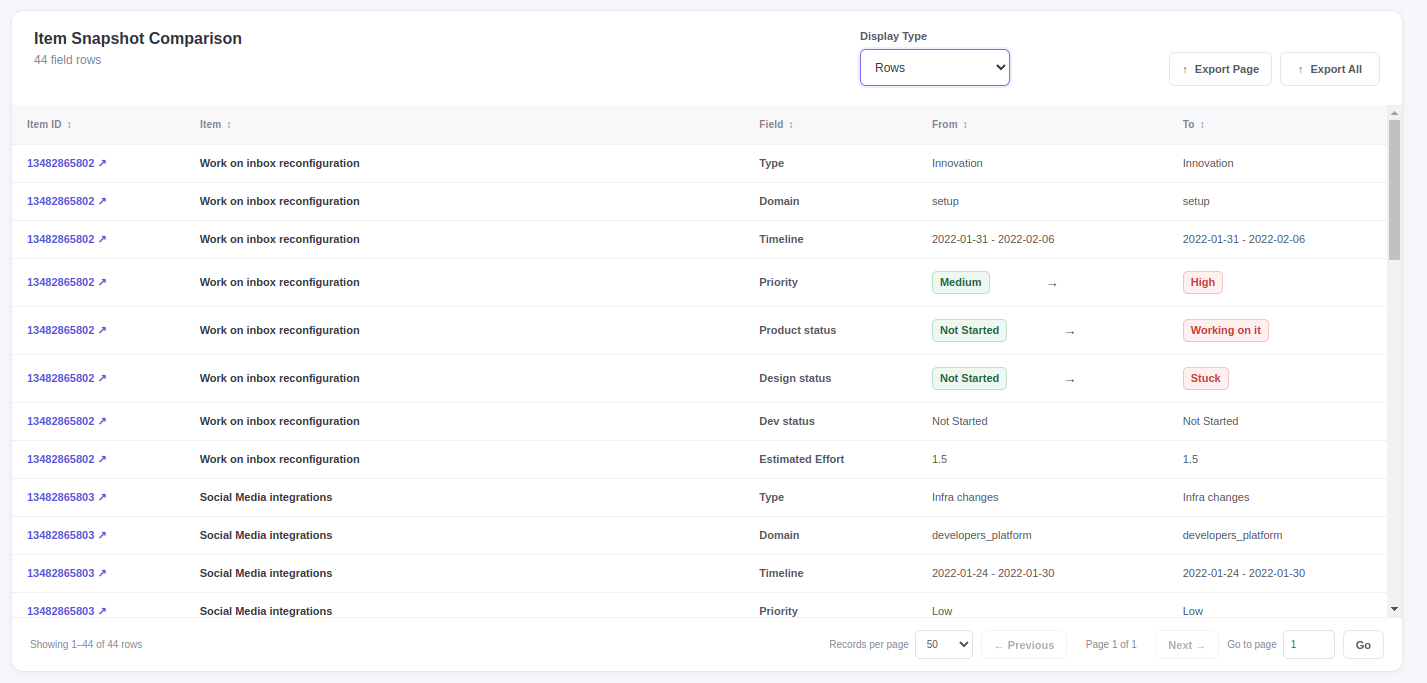
8.3 Display Type
The Display Type dropdown controls how the report data is presented, similar to switching between rows and columns in a pivot table.
Two display options are available:
Columns: Displays the report data vertically, with each reporting period represented as a column.
Rows: Displays the report data horizontally, with each reporting period represented as a row.
Both options present the same data, allowing you to choose the layout that best suits your analysis or for exporting to other systems, where the Rows format may be more suitable for further processing.
8.4 Selecting Visible Columns
The Select Visible Columns button allows you to configure which columns appear in the report.
Click Select Visible Columns.
Choose the columns you want to display.
Apply the selection.
Review the updated table.
This is useful when a board contains many columns and you only need a subset.
When exporting the report to CSV or Excel, you can choose to export either all available columns or only the columns selected for display using the Select Visible Columns button.
8.5 Sorting and Pagination
Use the sortable column headers to organize the results.
At the bottom of the table, use the pagination controls to navigate between pages or change the number of records displayed.
8.6 Exporting a Snapshot
Use:
Export Page to export the current page.
Export All to export the complete snapshot report.
9. Item Snapshot Comparison Report
The Item Snapshot Comparison report allows you to compare item data between two selected points in time.
This report is useful for identifying changes that occurred over a historical period.
For example, you can compare:
Item priorities before and after a sprint.
Product statuses at the beginning and end of a reporting period.
Changes to assignments or other board column values.
Historical item data across two selected dates.
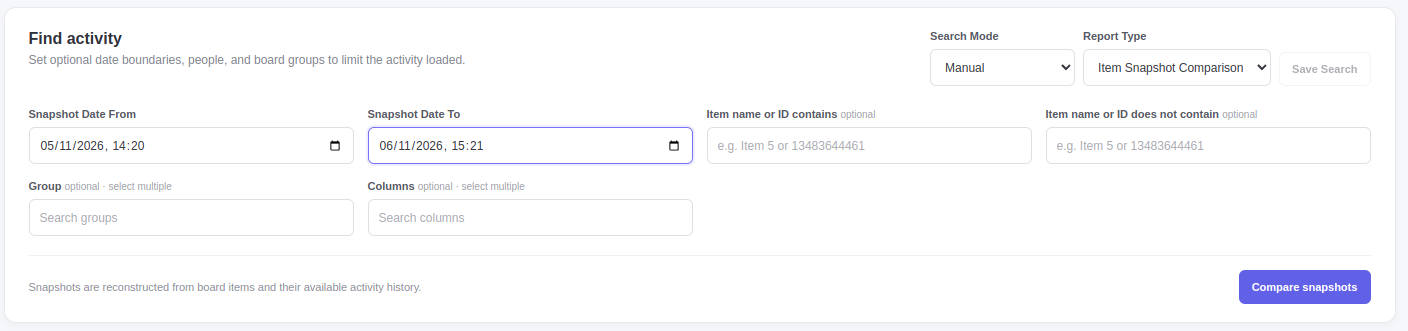
9.1 Creating a Comparison
Open the application.
Select Item Snapshot Comparison from the Report Type dropdown.
Configure the two historical points to compare.
Select any relevant item or column criteria.
Run the comparison report.
9.2 Understanding the Comparison Table
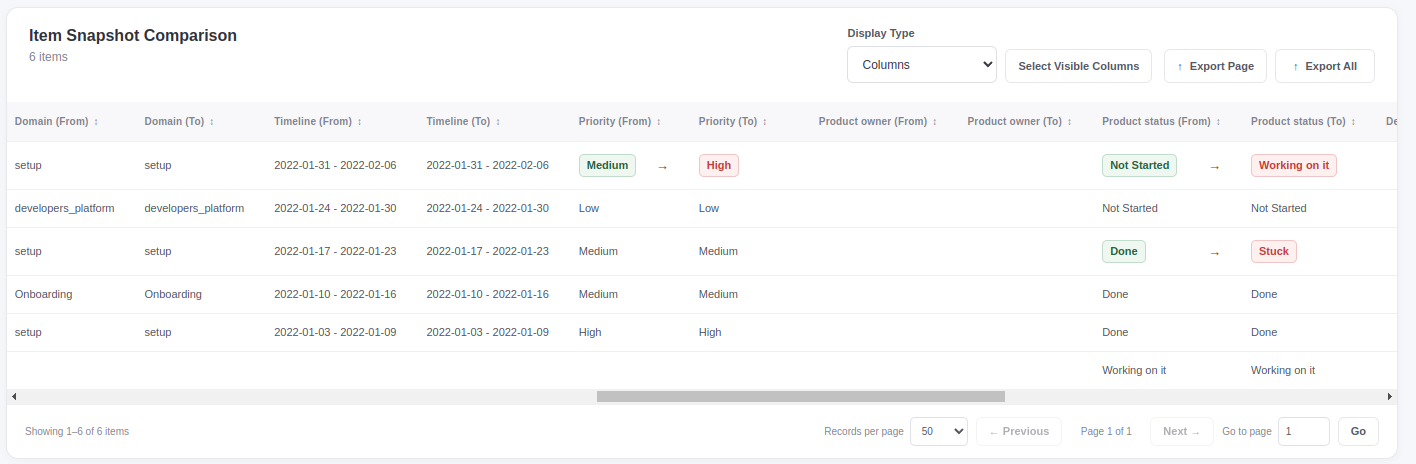
The report displays corresponding values from the two selected historical points.
Columns use the following naming convention:
Column Name (From) — Value at the first historical point.
Column Name (To) — Value at the second historical point.
For example:
| Priority (From) | Priority (To) |
|---|---|
| Medium | High |
| Low | Low |
| High | High |
This allows you to distinguish changed values from unchanged values.
Special Cases
Item did not exist: If an item did not exist at the selected snapshot date, all its column values for that historical point are displayed as N/A.
Empty column value: If the item existed at the selected snapshot date but a particular column had no value, that column is displayed with an empty colored badge.
This distinction allows you to identify whether an item did not yet exist or simply had no value assigned to a particular column.
9.3 Identifying Changes
The comparison report visually highlights certain differences between values.
For example:
Priority: Medium → High
Product status: Not Started → Working on it
Design status: Not Started → Stuck
Unchanged values can also be displayed, allowing you to compare the complete item data rather than only modified fields.
Display Type: Table
Display Type: Rows
9.4 Selecting Visible Columns
Click Select Visible Columns to control which columns appear in the comparison.
This is particularly useful because each compared field may require separate From and To columns, making the report wider than a standard snapshot.
9.5 Horizontal Scrolling
If the comparison contains more columns than fit on the screen, use the horizontal scrollbar at the bottom of the table.
9.6 Pagination
Use the records-per-page selector, Previous and Next buttons, or Go to page control to navigate the results.
9.7 Exporting Comparison Results
Use:
Export Page for the currently displayed records.
Export All for the complete comparison report.
10. Saving Searches
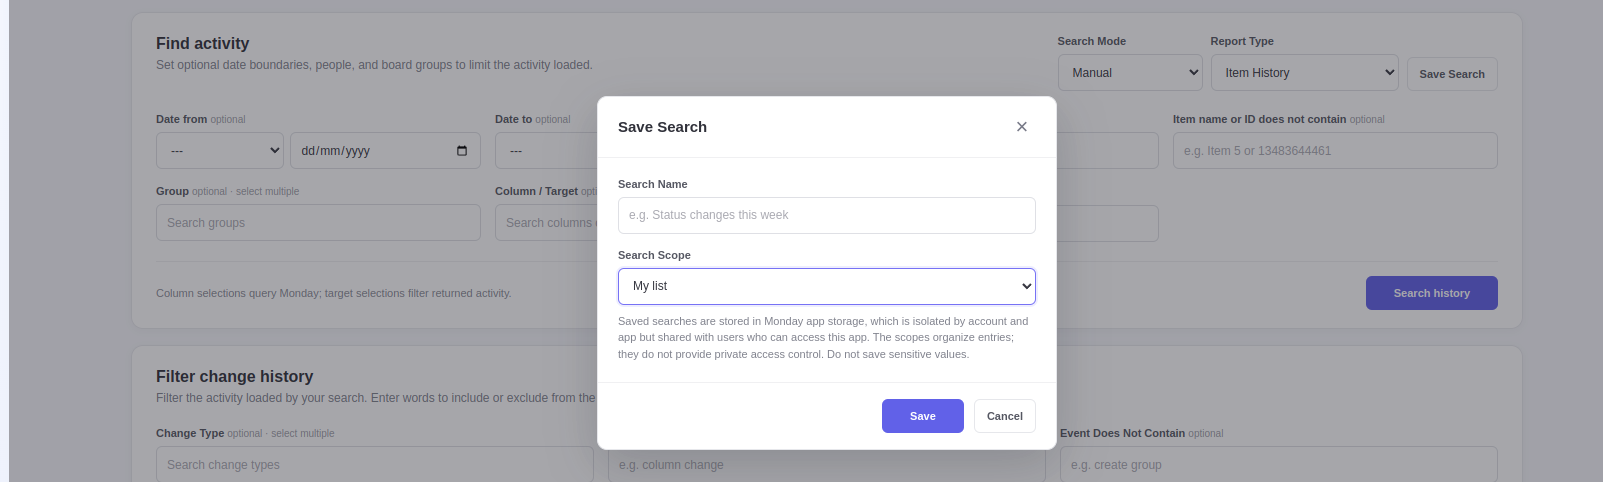
The application provides a Save Search button in the search section.
Saving a search allows you to retain a configured set of search criteria for later use.
Saving a Search
Saved searches allow you to reuse previously configured search criteria without having to enter them again.
To save a search:
Select the desired report type.
Configure the search criteria.
Execute the search.
Once the search has been performed, the Save Search button becomes enabled.
Click Save Search.
Choose where to save the search:
iMy List: The saved search is private and available only to the user who created it.
Account Shared: The saved search is shared and available to other users within the same Monday.com account.
Complete the save operation using the controls presented by the application.
Note: The Save Search button is enabled only after a search has been performed.
Reusing a Saved Search
To reuse a saved search, select it using the Search Mode dropdown.
Saved searches eliminate the need to repeatedly configure the same search criteria and are particularly useful for recurring investigations and reports.
Account Shared searches also allow teams to reuse consistent reporting criteria, ensuring that different users can generate reports based on the same configuration.
11. Practical Examples
Example 1 — Find Who Changed an Item's Status
Select Item History.
Enter the relevant item name or ID.
Select the status column in Column / Target.
Click Search history.
Examine the Changed at, Changed by, Old value, and New value columns.
Example 2 — Find Items Changed to Stuck
Select Item History.
Run the historical activity search for the desired period.
In Filter change history, enter
Stuckin New Value Contains.Click Filter Change History.
Review the matching events.
Example 3 — Investigate a Team Member's Activity
Select Item History.
Select the relevant person in Changed By.
Set the desired date boundaries.
Click Search history.
Review the activity table or switch to Charts for a summary.
Example 4 — Examine Historical Board Data
Select Item Snapshot.
Configure the desired historical date.
Run the report.
Use Select Visible Columns to focus on the required fields.
Export the results if needed.
Example 5 — Compare Two Historical Dates
Select Item Snapshot Comparison.
Configure the two dates.
Run the comparison.
Examine the From and To values.
Identify changes in statuses, priorities, or other fields.
Export the comparison if required.
12. Frequently Asked Questions
Do I need to add the application to every board?
Yes. After installing the application in your monday.com account, add it as a board view to each board where you want to use it.
Does installing the application automatically create a board view?
No. Installation makes the application available. You must add the view using the board's + button.
What is the difference between Item History and Item Snapshot?
Item History displays individual historical activity records.
Item Snapshot displays item values at a selected point in time.
What is the difference between Item Snapshot and Item Snapshot Comparison?
Item Snapshot displays item data for one historical point.
Item Snapshot Comparison displays corresponding values from two historical points, allowing you to identify differences.
Can I filter history by user?
Yes. Use the Changed By field to select one or more people.
Can I search for a particular previous or new value?
Yes. Use the Old Value and New Value contains or does-not-contain filters.
Are text filters case-sensitive?
No. Text matching in Filter change history ignores capitalization.
Can I display historical activity as charts?
Yes. Select Charts in the Activity log and configure the available chart grouping and type.
Can I export the reports?
Yes. The report tables provide Export Page and Export All options.
Can I customize which columns appear in snapshot reports?
Yes. Use Select Visible Columns.
Can I use the application on multiple boards?
Yes. Add the application as a board view to each required board.
13. Support
Item History & Snapshots Reporter is developed by Simitech Ltd.
For product information, documentation, and support, visit:
This documentation is available at: